LLM applications are quickly moving from experiments to real-world products. Once they reach production, basic logs are often insufficient to understand why responses fail, costs increase, or performance changes.
LLM Observability gives teams deeper visibility into prompts, outputs, latency, token usage, traces, and model behavior. Combined with effective LLM monitoring, it helps identify issues early and maintain more reliable AI applications.
This blog covers how LLM observability works, the metrics that matter most, common issues it can detect, implementation best practices, and how to choose the right LLM observability tools for production environments.
What Is LLM Observability?
LLM Observability is the process of understanding how a large language model application performs in real-world use. It gives teams visibility into prompts, responses, latency, token usage, retrieval steps, errors, and tool calls, making it easier to spot where performance drops or failures begin.
Unlike basic LLM monitoring, observability gives deeper context behind each issue. By connecting traces, logs, metrics, and evaluation data, teams can quickly identify the root causes of poor responses, rising costs, slow performance, or broken workflows and make more precise improvements.
Why LLM Observability Is Essential for Production AI Systems
Production LLM applications can fail in ways that standard monitoring does not always explain. A response may be technically successful but still be inaccurate, irrelevant, slow, expensive, or based on the wrong context. LLM Observability gives teams the visibility needed to trace these issues across model calls, prompts, retrieval steps, and tool interactions.
- Spot issues early: Trace request paths and identify where errors, poor outputs, or broken tool calls begin.
- Protect response quality: Track relevance, correctness, faithfulness, and hallucination risks as real users interact with the system.
- Control latency and cost: LLM monitoring helps teams spot rising response times, excessive token usage, and expensive model calls.
- Strengthen production safety: Observability can surface suspicious inputs, unsafe outputs, and unexpected agent behavior, while AI security and red teaming services can support deeper security testing.
LLM Observability vs LLM Monitoring and Traditional Observability
The three terms are related, but they serve different purposes. LLM monitoring tells teams when something is going wrong, while LLM Observability helps explain why it is happening. Traditional observability focuses more on the health of the overall software system, including servers, services, APIs, logs, and infrastructure.
| Aspect | LLM Observability | LLM Monitoring | Traditional Observability |
| Main Focus | Understand how the LLM application behaves and why issues happen | Keep track of known metrics and warning signs | Track the health of software and infrastructure |
| What It Looks At | Prompts, responses, retrieval, tool calls, latency, token usage, cost, and output quality | Errors, latency, usage, thresholds, and alerts | Logs, metrics, traces, APIs, servers, and services |
| When a Problem Happens | Helps teams trace the issue back to the exact model call, prompt, retrieval step, or tool action | Shows that a problem has happened | Helps locate failures across services or infrastructure |
| Response Quality | Can help assess whether responses are relevant, accurate, grounded, or safe | Usually tracks only predefined quality signals | Does not normally judge the quality of generated content |
| Best For | Debugging and improving production LLM applications | Day-to-day health checks and alerts | Keeping traditional applications and infrastructure reliable |
Core Layers and Components of an LLM Observability Framework
A strong LLM Observability framework connects the key parts of an LLM application so teams can understand how it behaves, where problems begin, and what needs to be improved.
1. Tracing and Logs
Track each request across model calls, retrieval steps, tool actions, and errors. This gives teams a clear view of the full workflow and makes debugging faster.
2. Prompt and Response Tracking
Monitor prompts and outputs to spot weak answers, unusual behavior, and changes after prompt updates. It also helps teams understand which inputs lead to poor results.
3. Retrieval and Context Visibility
See what information was retrieved and whether it was relevant enough to support the final response. This is especially important for finding gaps in RAG-based applications.
4. Quality Evaluation
Check whether responses are accurate, relevant, grounded, and safe using regular evaluation signals. This helps maintain consistent quality as the application grows and changes.
5. Performance and Cost Tracking
Use LLM monitoring to watch latency, token usage, model calls, and overall costs. This makes it easier to identify slow or expensive parts of the workflow.
6. Agent and Tool Visibility
Track agent decisions and tool calls to understand where multi-step workflows slow down or fail. This becomes especially useful when building systems with an AI agent development company.
What to Monitor in LLM Observability: Key Pillars and Metrics
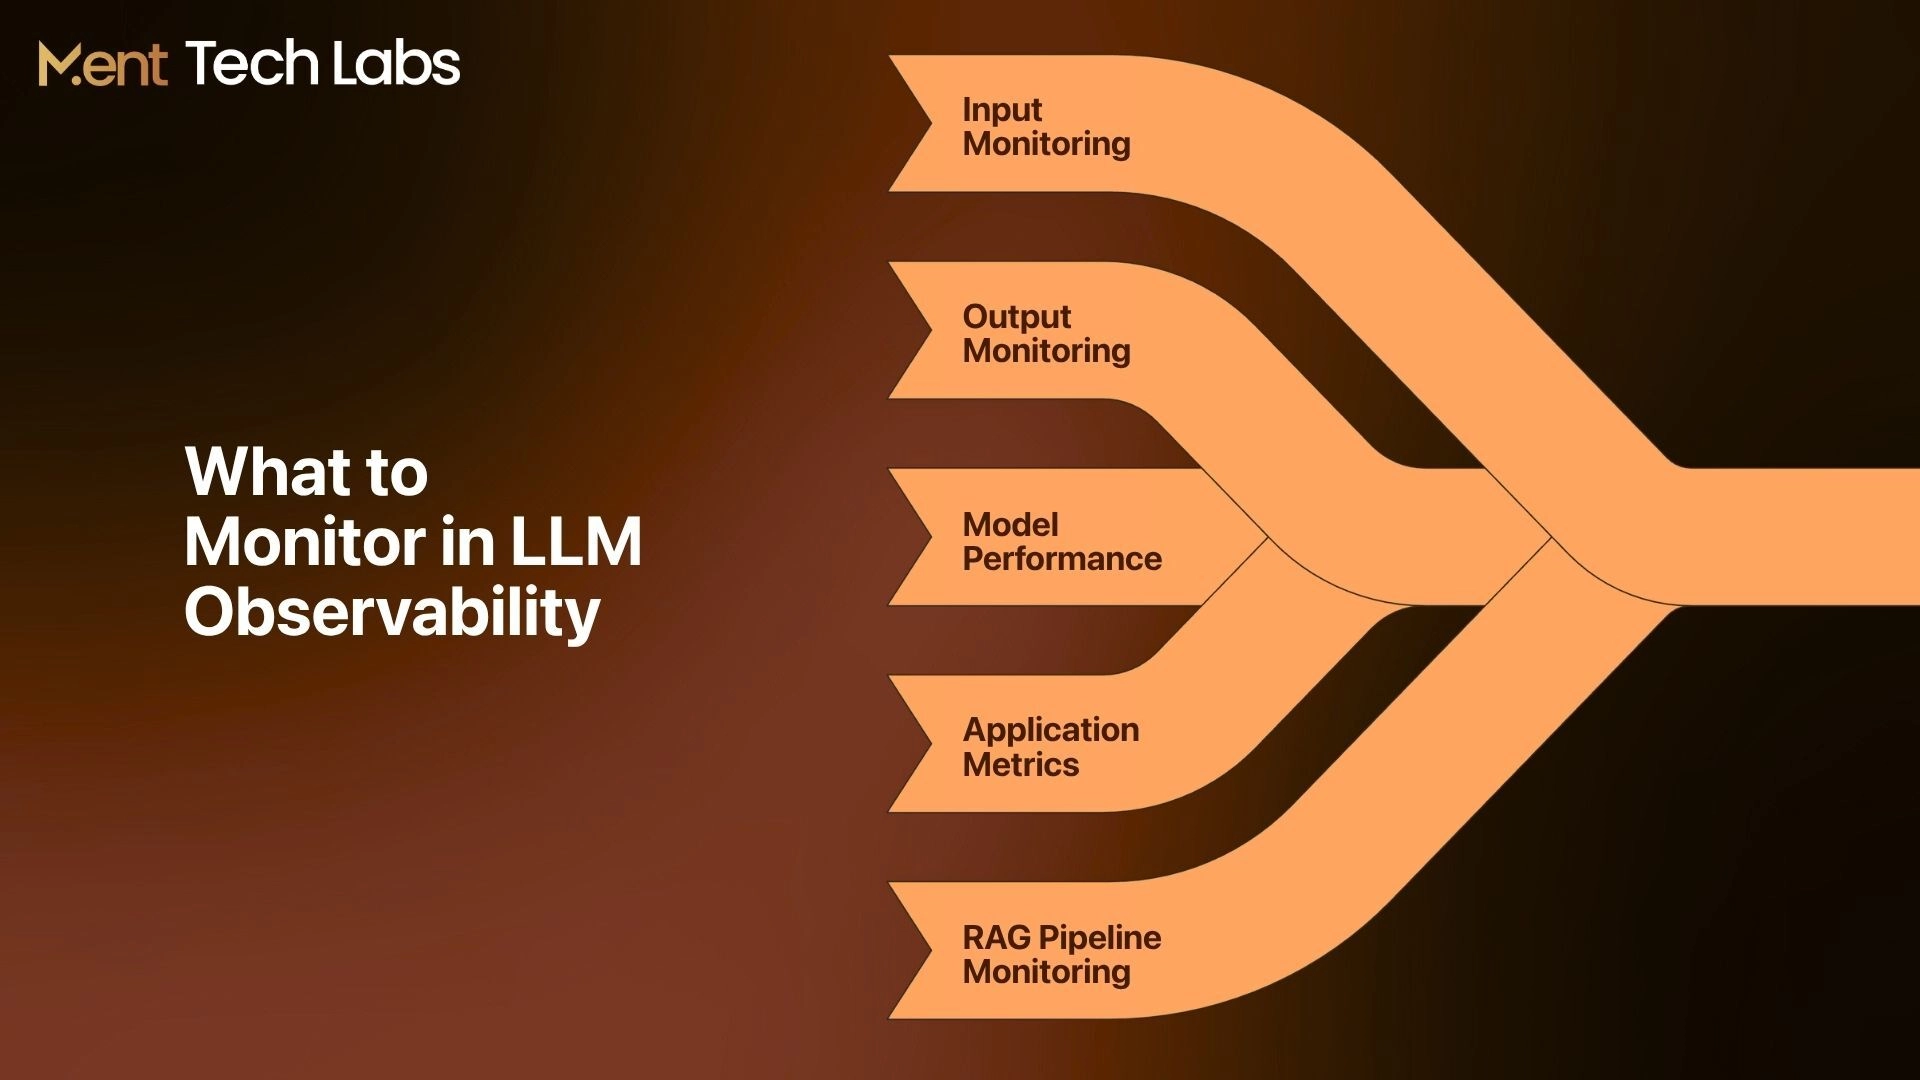
A strong LLM Observability setup looks at the full journey of a request, not just whether the model is online. These five areas give teams a clearer picture of quality, performance, cost, and reliability in production.
1. Input Monitoring
Start by understanding what users are sending into the system. Changes in input quality or behavior can directly affect the responses an LLM produces.
- Prompt length: Track unusually short or long prompts that may affect quality or cost.
- Risky inputs: Flag suspicious, unsafe, or unexpected requests before they cause problems.
- Input patterns: Watch changes in user queries to understand how the application is actually being used.
2. Output Monitoring
The final response is what users experience, so its quality needs regular attention. Output monitoring helps catch weak or unsafe answers before they become a recurring issue.
- Answer quality: Check whether responses are accurate, relevant, and useful.
- Hallucination risk: Look for answers that sound confident but are not supported by facts or context.
- Unsafe outputs: Identify sensitive, harmful, or incomplete responses that need review.
3. Model Performance
Model performance shows whether the LLM is responding reliably under real workloads. Tracking it over time makes unusual changes easier to spot.
- Response latency: Measure how long the model takes to generate an answer.
- Token usage: Watch input and output tokens to keep usage and costs under control.
- Model errors: Track failed calls, timeouts, and other issues affecting model reliability.
4. Application Metrics
The model is only one part of the application. LLM monitoring should also cover the APIs, tools, and services that support the full user experience.
- Request success: Measure how many user requests complete successfully.
- Tool failures: Track broken API calls, agent actions, and external integrations.
- Request cost: Understand how much each interaction costs across the full workflow.
5. RAG Pipeline Monitoring
For RAG applications, good answers depend heavily on the information retrieved before generation. Monitoring this layer is especially important for systems built through generative AI development services, where response quality depends on reliable context and retrieval.
- Retrieval relevance: Check whether retrieved documents actually match the user’s question.
- Context quality: Make sure the information passed to the model is useful and complete.
- Response grounding: Track whether final answers stay supported by the retrieved content.
What Common Issues Can LLM Observability Detect in AI Applications?
LLM Observability helps teams catch problems that are easy to miss with basic system monitoring. It gives a clearer view of how prompts, responses, model behavior, costs, and security risks change once an application is used by real users.
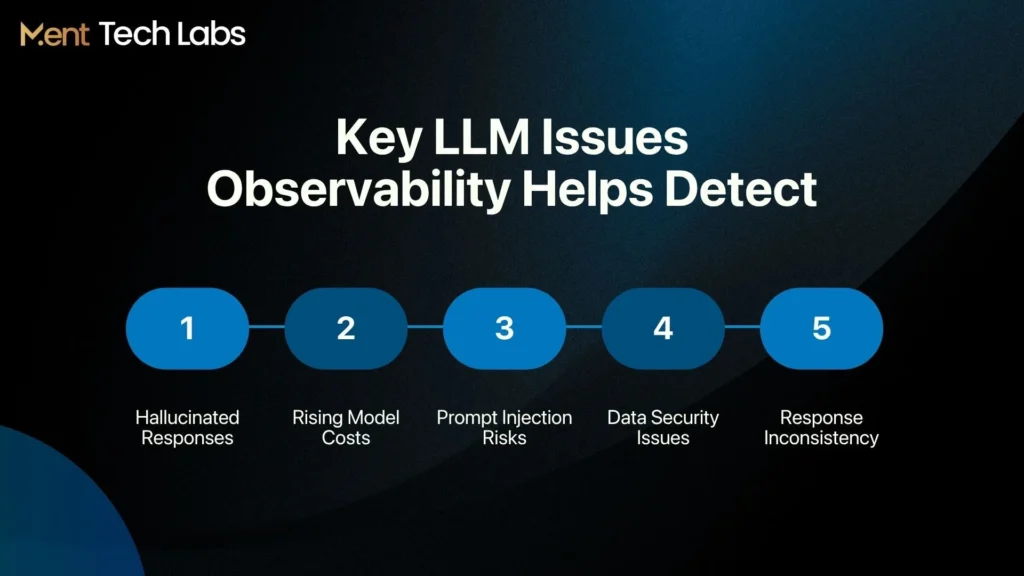
1. Hallucinated Responses
Certain prompts or use cases may trigger LLMs to produce responses too confidently. LLM monitoring will help your team identify these moments and work toward correcting the issues.
2. Rising Costs
Token-heavy prompts, repeated model calls, and slow third-party APIs can quickly increase operating costs. The right LLM observability tools make it easier to see where spend is growing and which workflows need attention.
3. Prompt Injection
Users may try to manipulate prompts to bypass instructions or force the model into unwanted behavior. Observability helps surface unusual prompt patterns and unexpected outputs before they become a larger issue.
4. Data and Security Risks
LLM applications can expose sensitive information, mishandle user data, or behave in ways that create security concerns. Strong observability works well alongside AI security and red-teaming services to uncover these risks earlier.
5. Response Inconsistency
Different questions can have different results based on how they’re asked, in what context, how the model’s working, etc. Monitoring variations in prompts and output allows teams to eliminate unnecessary variability and maintain a more reliable user experience.
How to Implement LLM Observability for Production AI Applications
A good LLM Observability setup should help teams see what is happening, catch issues early, and improve the system without adding unnecessary complexity.
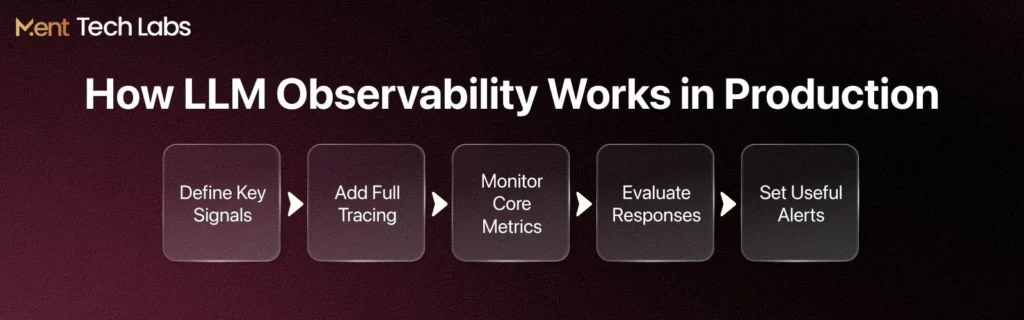
Step 1. Define Key Signals
Start with the metrics that directly affect users and business performance, such as latency, cost, errors, response quality, and retrieval accuracy. Keeping the list focused makes the data easier to act on.
Step 2. Add Full Tracing
Trace each request from the first prompt through model calls, retrieval steps, tool use, and the final response. This gives teams a clear view of where delays or failures actually begin.
Step 3. Monitor Core Metrics
Use LLM monitoring to track latency, token usage, error rates, model costs, and request volume. Watching these signals over time helps teams catch unusual changes before they become larger problems.
Step 4. Evaluate Responses
Check whether outputs are accurate, relevant, grounded, and safe for the intended use case. Regular evaluations also make it easier to see when prompt or model changes affect response quality.
Step 5. Set Useful Alerts
Set up alerts for significant changes such as a cost spike, slower response time, increase in error rate, or degradation in quality. The goal of the alerting should be to direct attention to what really matters, not generate false alarms.
Final Thoughts
Once an LLM application is live, it becomes much harder to understand what is happening behind every response. LLM Observability gives teams a clearer view of prompts, outputs, costs, latency, retrieval, and model behavior so problems are easier to find and fix.
Good observability is not just about watching dashboards. It helps teams catch weak responses, slow workflows, rising costs, and reliability issues before they start affecting more users.
For businesses building or improving production LLM systems, working with an experienced LLM company can make the process easier from the start. Contact Ment Tech to build a more reliable, secure, and scalable LLM application.